Turn farm data into decisions.
Reporting and predictive models, including the Horizon growth model, that turn biological and financial data into insight you can act on. Rich dashboards, specialised reports, and forecasts trained on real production data.
From raw data to real insight.
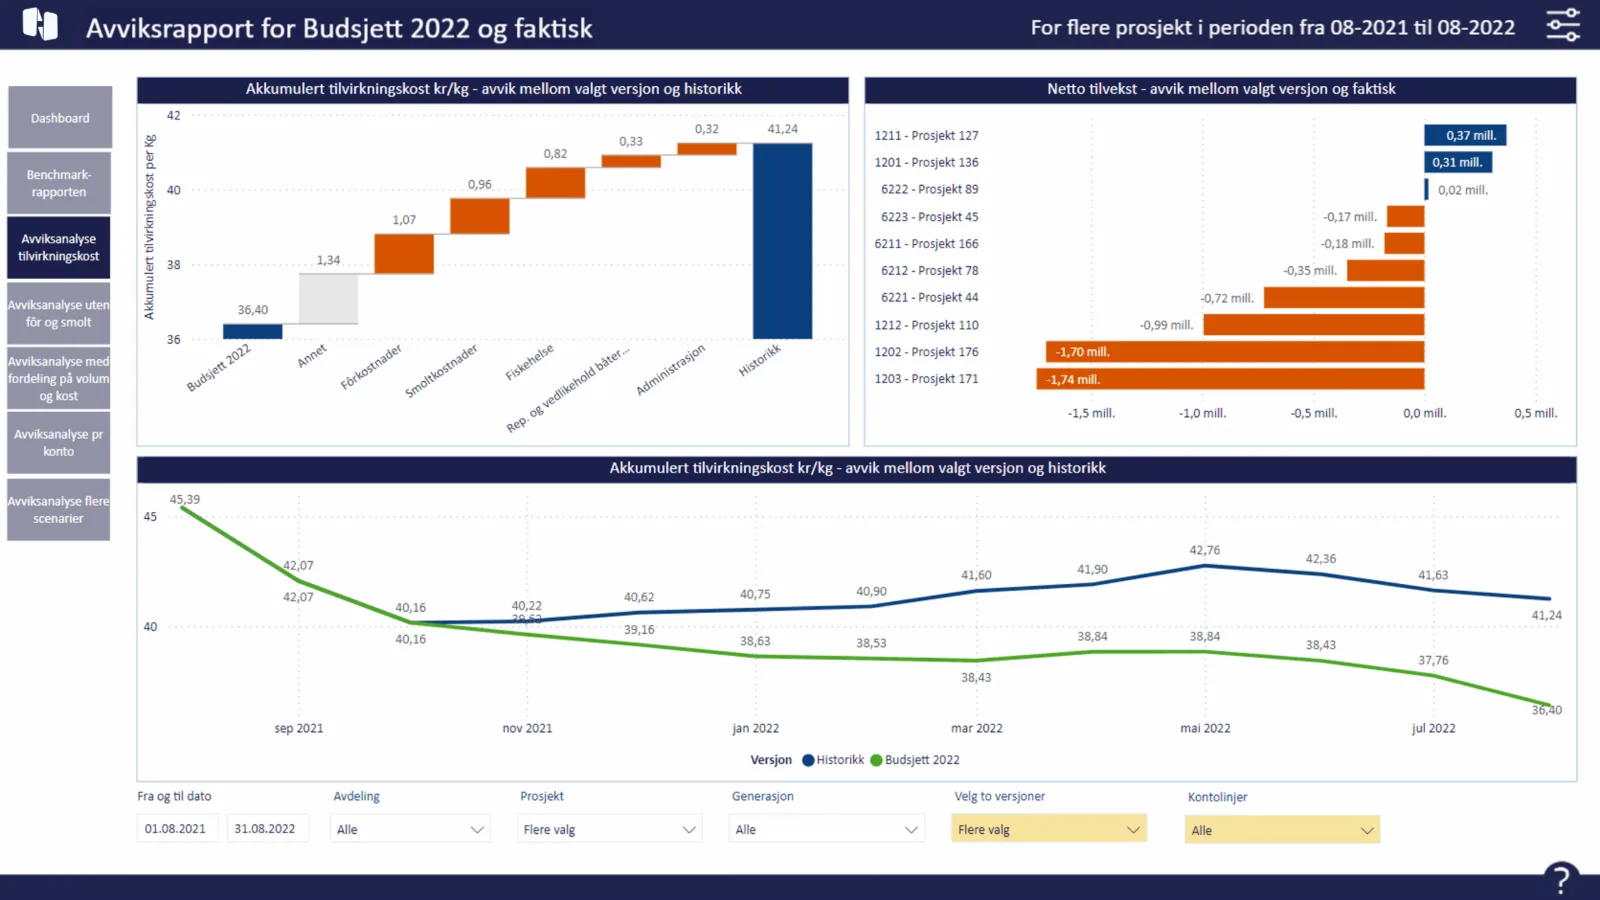
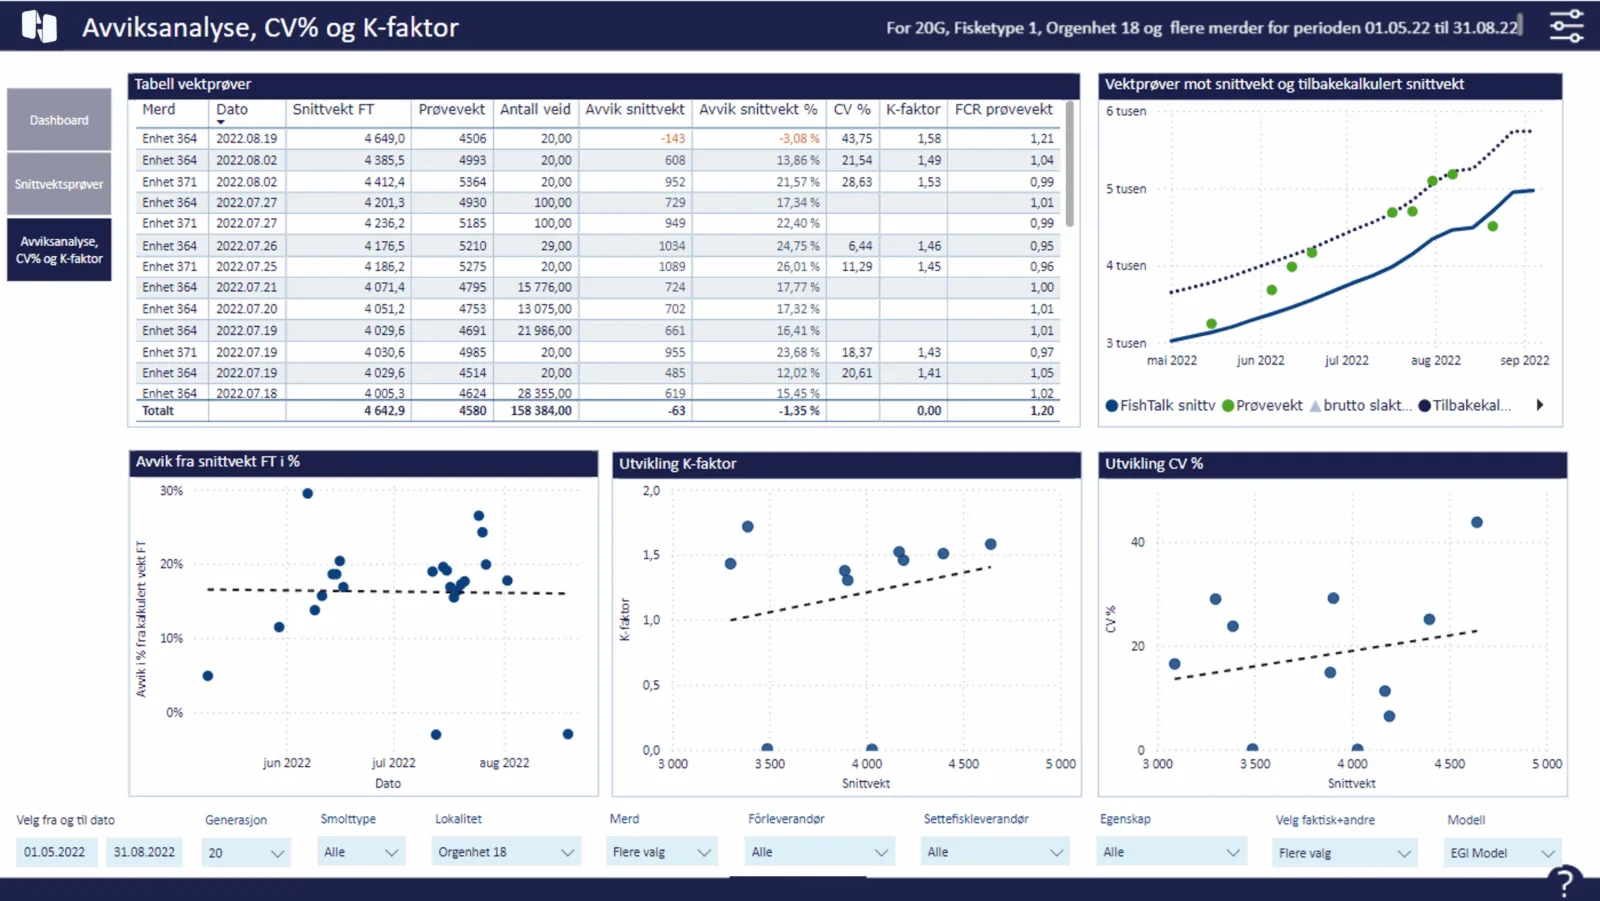
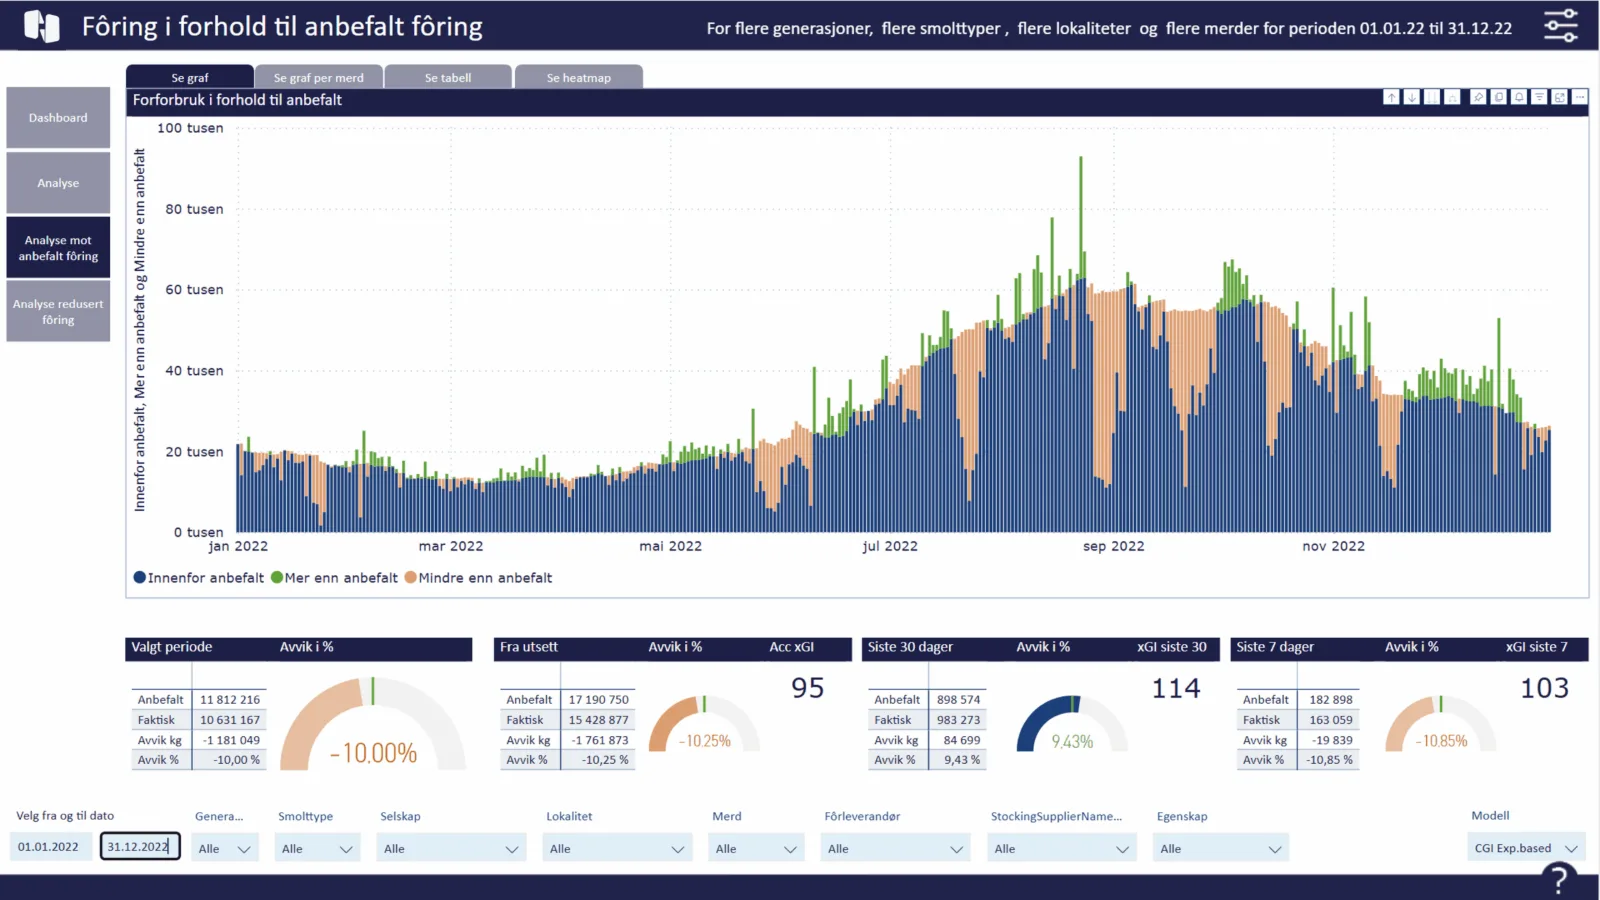
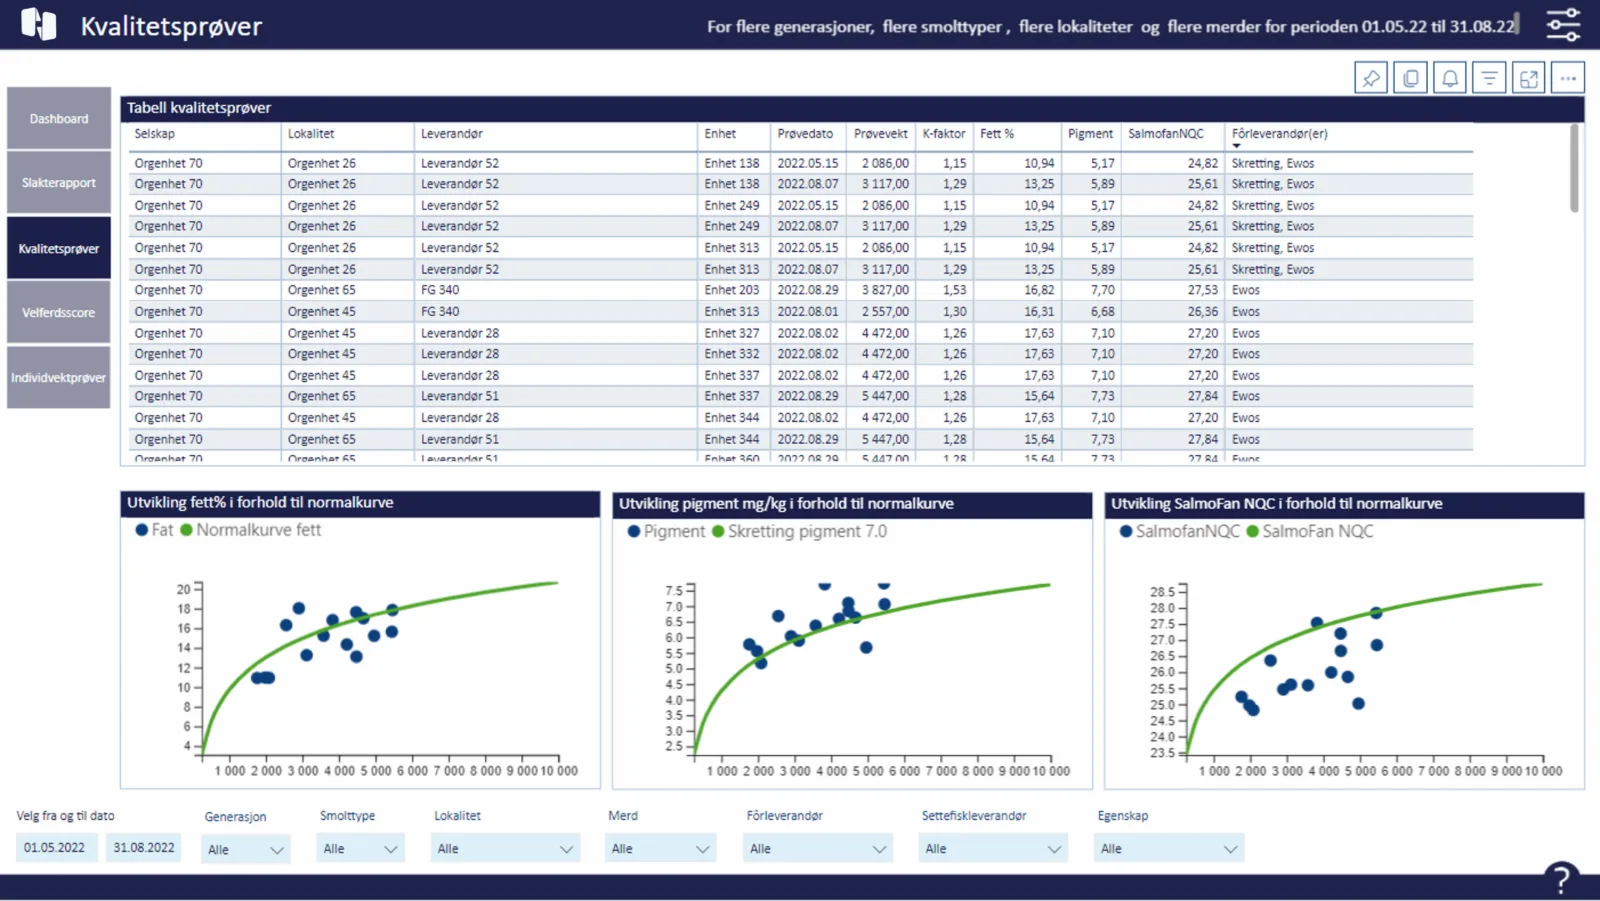
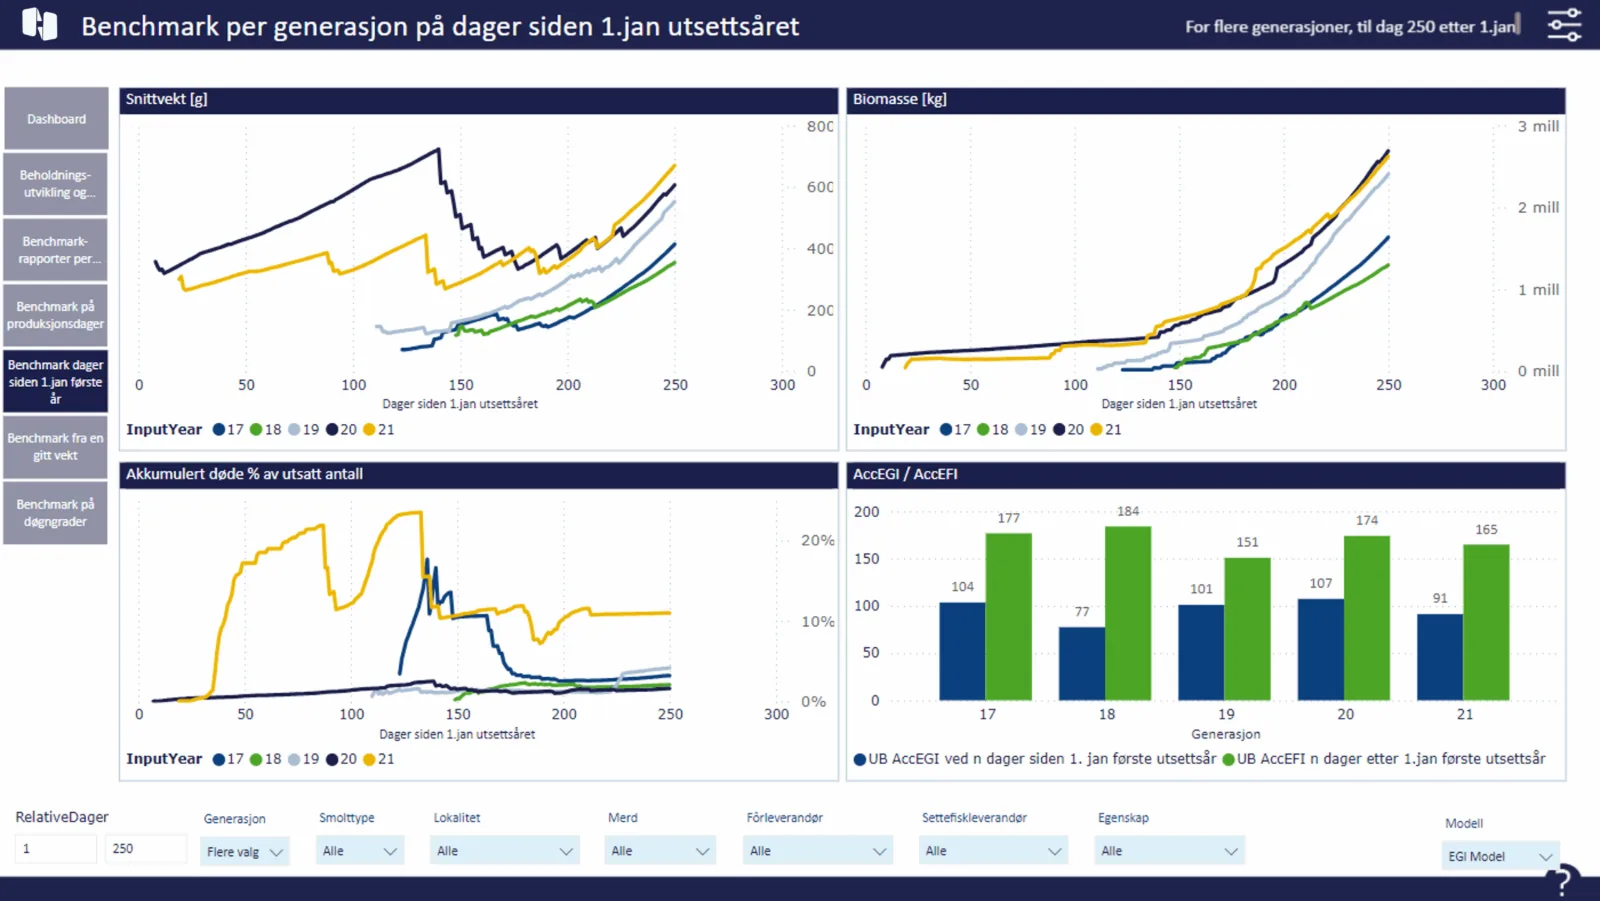
Horizon Omnia is our reporting platform: it gathers data from several sources for rich, combined reporting and presents it in interactive dashboards. Alongside standard views you get specialised reports such as Altinn reporting, insurance reports and timeline, for new insight into both production and economy.
Horizon Analytics adds predictive models on top of your data, helping you see where production and cost are heading before it shows up in the result. Prefer your own tools? Figures export cleanly to Excel or Power BI for further analysis.
At the core sits the Horizon growth model for salmon, machine-learning driven and built on a unique dataset covering 37% of Norwegian salmon production, giving market-leading forecast accuracy that feeds straight back into planning and budgeting.
Omnia reporting
Gathers data from multiple sources into one platform for rich, combined reporting across production and economy.
Interactive dashboards
Visualise your numbers in live, drillable dashboards, from company overview down to the single transaction.
Specialised reports
Ready-made reports for Altinn, insurance and timeline views, plus tailored reports built for your business.
Predictive analytics
Models that look ahead. They surface where production and cost are heading so you can act before it lands in the result.
Horizon growth model
ML-driven growth model built on 37% of Norwegian salmon production, for market-leading forecast accuracy.
Export to Excel & Power BI
Prefer your own toolchain? Export figures cleanly to Excel or Power BI for further analysis.
What's inside reports & analytics.
Horizon Omnia
Gathers data from several sources for rich, combined reporting in interactive dashboards, with specialised reports like regulatory, insurance and timeline.
- Multi-source interactive dashboards
- Regulatory, insurance & timeline reports
- Works with CTRL & the finance suite
Horizon Analytics
Predictive models on top of your data that surface where production and cost are heading before it lands in the result. Export to Excel or Power BI when you prefer your own tools.
- Forward-looking forecasts
- Export to Excel & Power BI
Horizon Harmony
The data-flow layer beneath the suite: seamless integration with your key production and accounting systems, combining planning and production data for analysis, with full traceability down to pen or fish.
- Integrates your production & accounting systems
- Registered Snowflake partner; feeds Power BI
- Supports your data-warehouse strategy
Horizon Growth Model
A machine-learning growth model built on a unique dataset covering 37% of Norwegian salmon production. We hit 97% growth accuracy in 80% of stockings, market-leading forecast accuracy that feeds back into planning and budgeting.
- Trained on 37% of Norwegian salmon
- 97% growth accuracy in 80% of stockings
- Feeds planning & budgeting
Real dashboards from Horizon Omnia.
From scattered data to insight.
- 1
Connect the sources
Data from Horizon and your other systems is connected into Omnia.
- 2
Gather in one model
Omnia brings biology and economy together in one data foundation.
- 3
Dashboards & reports
Follow key figures in real time and build the reports you need.
- 4
Share across the org
Give the whole organisation the same up-to-date picture.
Want to see all your data in one dashboard?
We'll show how data from your systems comes together in Omnia: dashboards, reports and forecasts.
Worried about the switch itself? See how we make changing systems easy →